Dashboard
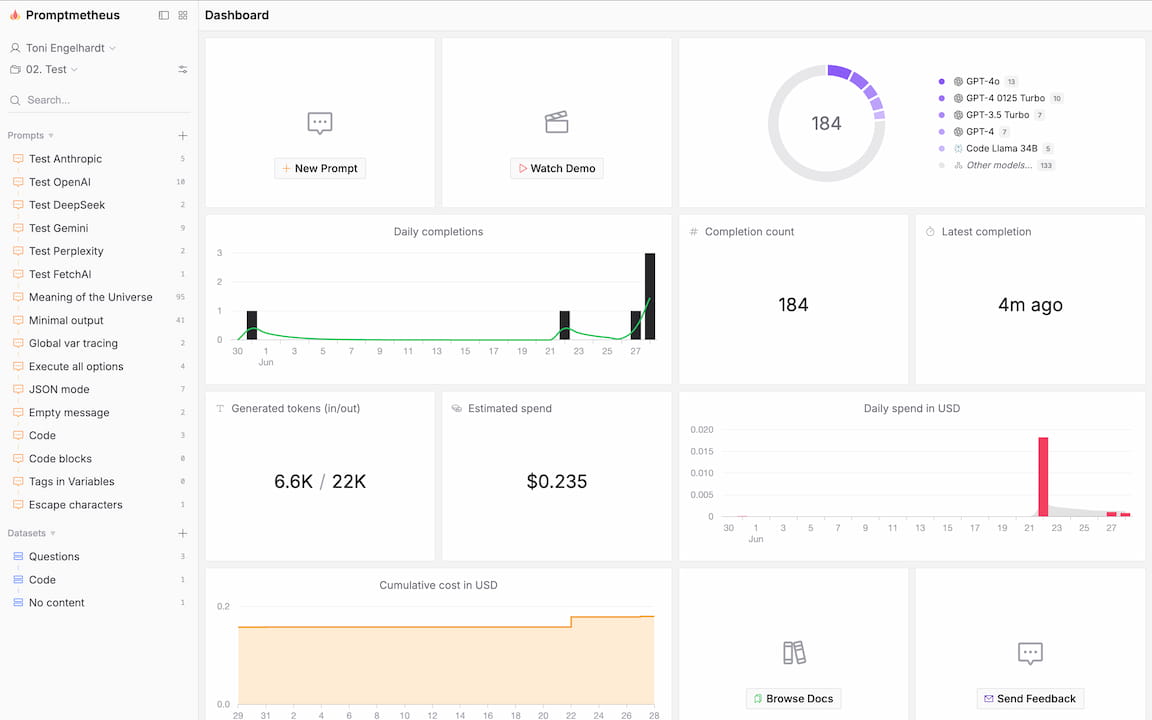
The dashboard is designed to give you a quick overview of a project with all the important charts and numbers at a glance.
Data is limited to the scope of the currently selected project.
Important
- Token counts are estimates and all derived values (like cost) are therefore not 100% accurate.
- Reasoning tokens are currently not included in the estimates.
Metrics
Total Spending
Estimate of the total cost of all Completions generated in this project. Take a look at the "Token Price" section to see how Completion costs are calculated.
Input/Output Tokens
Total counts of all input (context) and output (completion) tokens generated in the project.
Charts
Completion Model Distribution (purple)
Distribution of completion counts per model, with the top 6 in purple and the rest aggregated in gray.
Daily Token Generation (yellow/orange)
Daily count of generated input (orange) and output (yellow) tokens over the last 30 days.
Completion Provider Distribution (green)
Shows the distribution of completion counts per provider, with the top 6 in green and the rest aggregated in gray.
Daily Spending (rose)
Total daily token cost over the last 30 days.
If there are any metrics you are missing, please get in touch and request them.